Raw DOE results from Moldex3D can seem overwhelming at first glance, but the statistical outputs tell a clear story when you know what to look for. Start by examining the main effects plot, which shows how each individual process parameter influences your response variables like part weight, cycle time, or defect rates. A steep slope indicates a parameter has significant impact, while flat lines suggest minimal influence.
The correlation matrix reveals which parameters work together and which fight against each other. For instance, you might discover that increasing injection pressure correlates strongly with reduced short shots, but also increases flash formation. These relationships aren't always obvious from experience alone, making the statistical analysis invaluable for understanding your process dynamics.
Pay special attention to the R-squared values and confidence intervals. An R-squared above 0.8 typically indicates your model captures the process behavior well enough for optimization decisions. However, don't ignore parameters with lower statistical significance – they might become critical under different operating conditions.
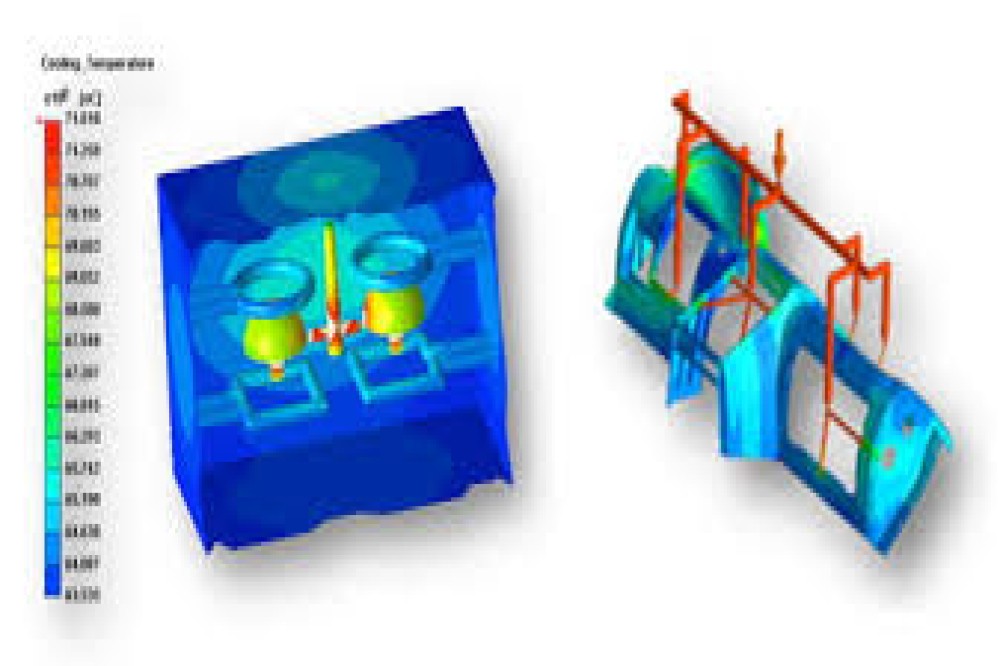
Creating process windows means finding the sweet spot where your parts meet specifications consistently, even with normal manufacturing variations. Moldex3D's contour plots and response surfaces make this visual and intuitive. You can see exactly where your process parameters need to stay to maintain quality standards.
The key is building in safety margins. If your simulation shows optimal results at 180°C melt temperature, consider setting your process window from 175°C to 185°C. This accounts for real-world temperature fluctuations, material lot variations, and machine wear over time.
Response surface methodology helps you understand how steep or gradual the quality cliffs are around your optimal settings. Some processes have wide, forgiving windows where small parameter changes barely affect quality. Others have narrow peaks where tiny shifts cause major problems. Knowing which type you're dealing with shapes your control strategy and operator training needs.
Two-factor interactions often drive the most significant quality issues, yet they're impossible to predict without DOE analysis. Your simulation might reveal that mold temperature and injection speed create a synergistic effect – individually, each parameter shows modest impact, but together they dramatically influence part warpage.
Interaction plots display these relationships clearly. Look for crossing lines, which indicate the effect of one parameter depends entirely on the setting of another. For example, higher holding pressure might reduce sink marks at low melt temperatures but increase them at high temperatures. These insights prevent you from chasing individual parameter adjustments that miss the real root cause.
Three-way interactions occasionally surface in complex geometries or challenging materials, but they're typically less impactful than two-factor interactions. Focus your attention on the strongest two-factor relationships first.
Transform your DOE insights into bulletproof process recipes by targeting parameter combinations that deliver consistent results across the widest possible operating range. This means sometimes choosing settings that aren't absolutely optimal for nominal conditions, but perform reliably when conditions inevitably drift.
Build your recipes with realistic tolerances based on your equipment capabilities. If your temperature controllers hold ±3°C, design your process window accordingly. Include clear specification limits for critical responses and establish monitoring protocols for early warning when processes drift toward boundaries.
Document the rationale behind each parameter choice, especially when settings seem counterintuitive. Your DOE analysis might show that slightly higher injection speeds actually reduce cycle time variation, even though conventional wisdom suggests the opposite. Recording this reasoning prevents future "improvements" that unknowingly compromise robustness.